Introduction
Azure Virtual Desktop (AVD) can feel slow in many ways: delayed logons, laggy input, frozen screens, hanging applications, or random disconnects. Often every Azure resource still shows as available.
That's because AVD performance is an end-to-end experience. Session hosts, user density, profiles, storage, identity, applications, network transport, and endpoints all play a part. No single setting explains it.
Microsoft notes that a host can accept connections while still needing assistance, so uptime alone tells you little. This guide walks through common causes, the telemetry to collect, targeted fixes, validation, prevention, and when to bring in a specialist.
Key Takeaways
- Common culprits: oversized density, FSLogix and storage bottlenecks, network latency, image overhead, and peak capacity gaps.
- Most issues yield to evidence-based tuning; repeat offenders may need redesign.
- Define the symptom, compare hosts and users, check telemetry, change one thing, validate.
- Get help when problems are widespread, recurring, regulated, or poorly monitored.
What Is Azure Virtual Desktop Performance?
AVD performance is the responsiveness, availability, and stability users experience while signing in, launching apps, working in the desktop, and keeping a session alive.
The layers that shape it
- Endpoint and local network
- Identity and authentication
- AVD brokering and gateway
- Host pool and session host resources
- FSLogix profile storage
- Business applications
- Remote display transport
Infrastructure health versus user experience
A session host can show normal availability while users suffer slow logons, input delay, or app hangs. Measure both.
Microsoft's Insights glossary rates user input delay as follows:
| Rating | Input delay |
|---|---|
| Good | Under 150 ms |
| Acceptable | 150-500 ms |
| Poor | 500-2,000 ms |
| Bad | Over 2,000 ms |
Microsoft's connection-quality guidance targets round-trip time (RTT) under 150 ms, with over 200 ms likely to affect the experience. For CPU, memory, disk latency, and logon duration, Microsoft gives no universal cutoffs. Correlate them with input delay instead.

Common Problems and Root Causes
Complaints follow recognizable patterns. Knowing when and where a problem occurs beats resizing a VM on instinct.
Slow logons, black screens, or delayed profile loading
Symptoms: long waits after authentication, black screens, or apps that appear late.
Likely causes:
- Large FSLogix containers or slow, saturated profile storage
- Antivirus scanning profile files
- Heavy group policy processing
- Identity delays and startup tasks
- Login storms at shift start
Microsoft also documented a case where some multi-session hosts showed 10-30 minute black screens after certain 2024 updates. That was a specific incident, not a general explanation.
Input lag, freezing, or poor responsiveness
Lag usually traces to the network path or host pressure. Common drivers include:
- High RTT or packet loss
- Congested client networks
- Graphics-heavy workloads
- Host CPU, memory, or disk pressure
Compare client location, connection type, RDP transport, host usage, and timing before touching VM sizes.
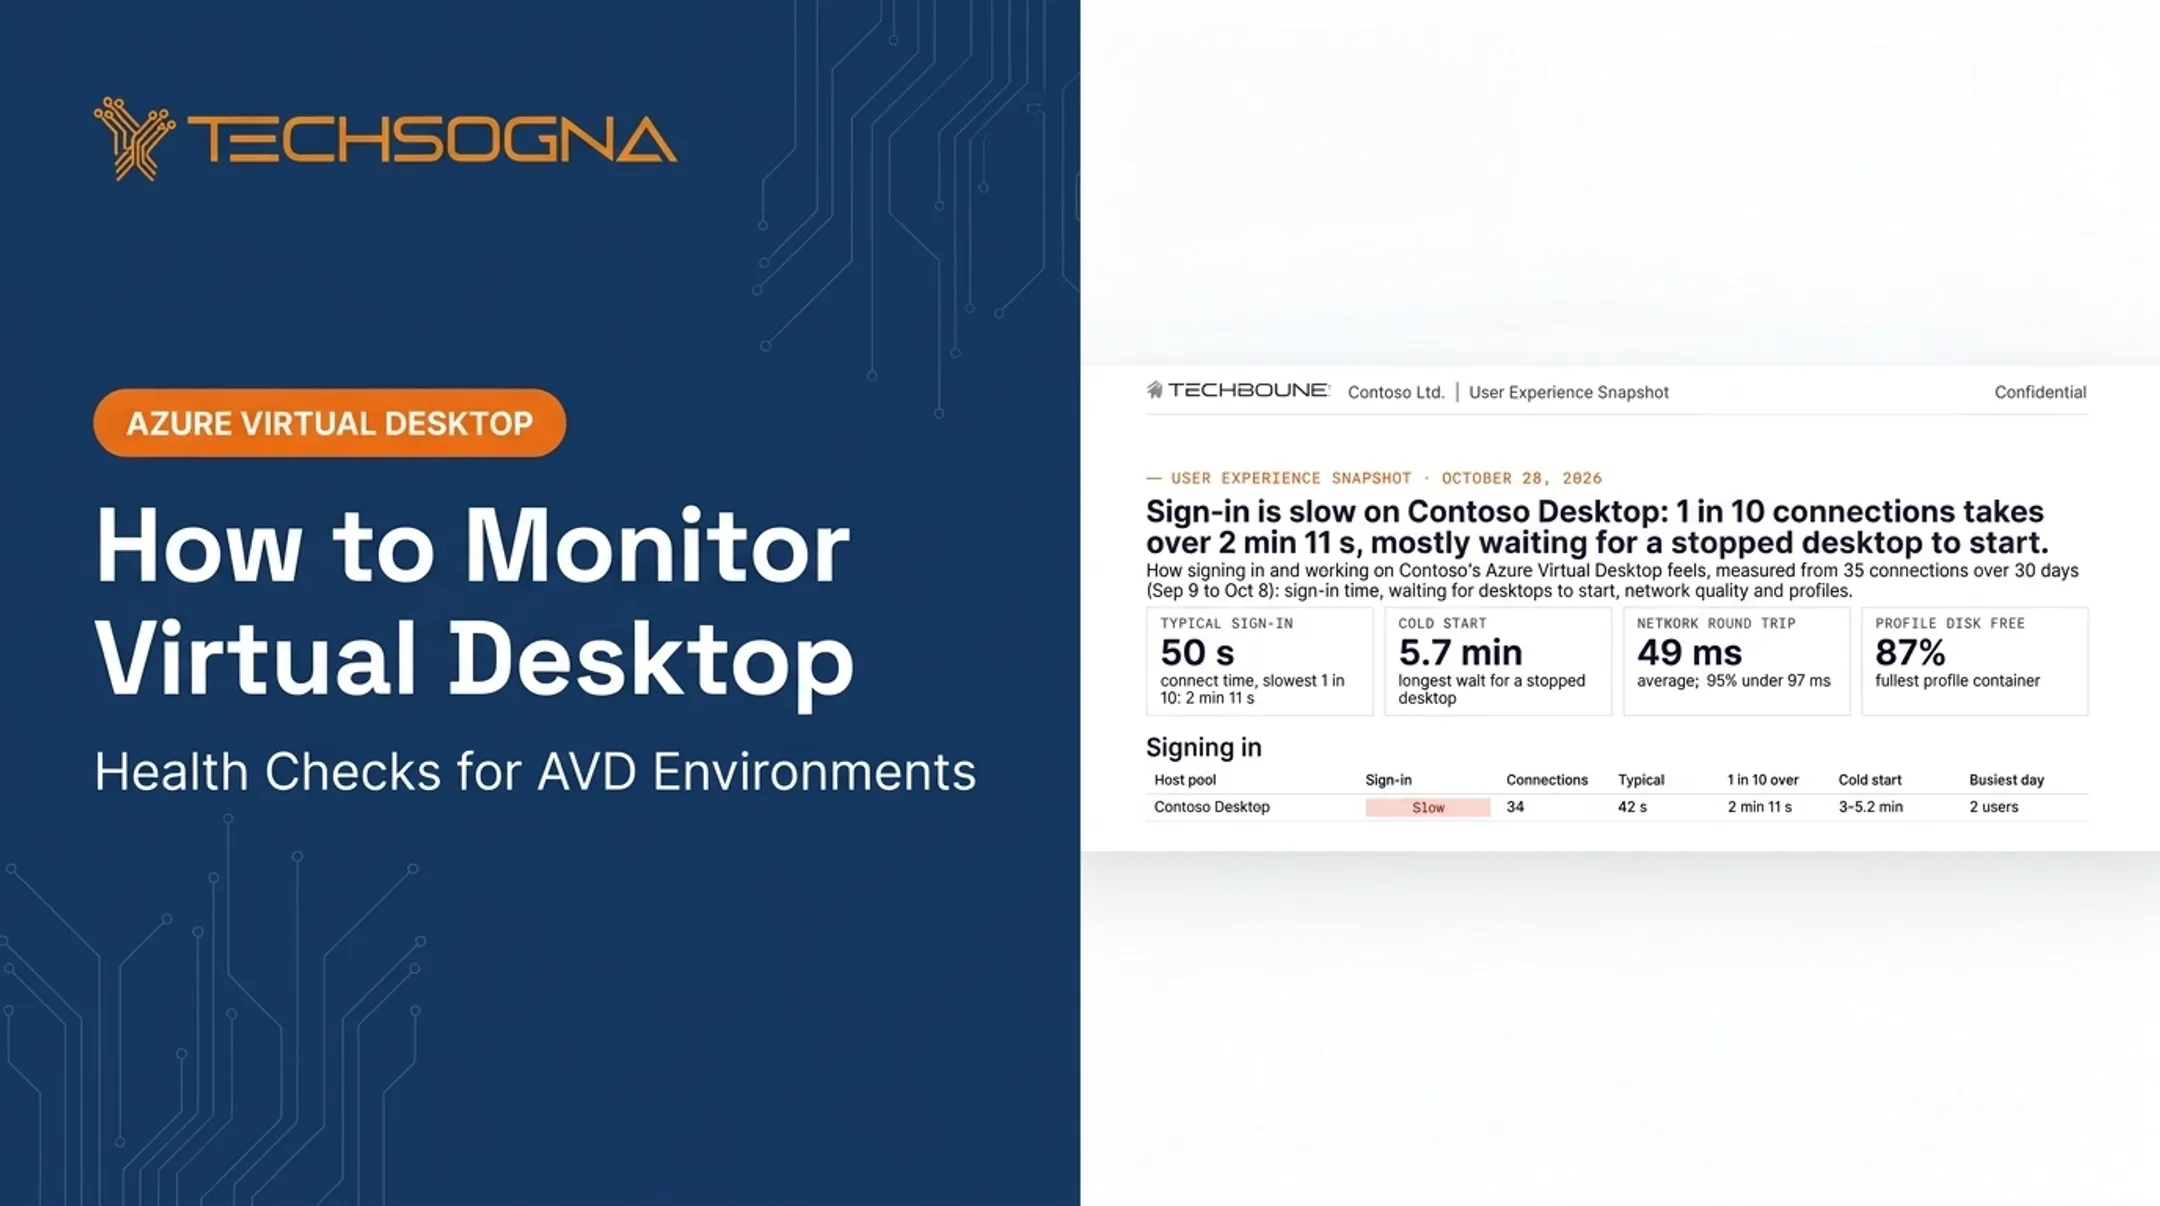
TechSogna's health check findings illustrate the transport point: one sample environment showed healthy latency (47 ms average) yet every connection ran over TCP, with RDP Shortpath unused.
Slow or crashing applications
Likely causes:
- CPU contention, memory pressure, and disk queuing
- Background processes and heavy applications
- Teams media not optimized
- Excessive multi-session density
One resource-hungry user can degrade everyone on the same host.
Disconnects and unavailable hosts
Likely causes:
- Unstable endpoint networks
- Registration failures, agent, or broker problems
- Maintenance windows and capacity shortages
- Incorrect network security rules
Correlate failures with host availability, agent status, identity events, network data, and Azure service health. Don't assume every disconnect is a user's Wi-Fi.
Peak-period slowdowns
Predictable slowdowns often come from:
- Morning login surges
- Uneven load balancing
- Insufficient pre-start capacity
- Delayed autoscaling
Compare peak and off-peak trends to decide whether the cause is capacity, scaling policy, or a workload pattern like meetings.
Cold starts matter too. In one sample TechSogna analysis, no desktops were running at work start, and cold starts left users waiting up to five minutes.

How to Troubleshoot and Fix AVD Performance
Changing settings before isolating the symptom can raise costs, disrupt users, and bury the real cause. Move from observation to evidence, targeted fix, and validation.
Step 1: Define and reproduce the exact symptom
- Note whether it affects one user, a group, one host, a whole pool, or several locations.
- Record when it happens: sign-in, app launch, video meetings, peak hours, or constantly.
- Compare affected and unaffected users, endpoints, apps, hosts, and network paths.
Step 2: Confirm the affected dependency layer
- Check Azure Service Health, host pool status, registration state, identity services, and recent changes.
- Classify the bottleneck: compute and density, storage and FSLogix, network, identity and policy, image and app, or endpoint.
- Rule out home Wi-Fi, VPN routing, local device limits, and security software.
Step 3: Collect the right evidence
AVD Insights needs the Azure Monitor Agent, a data collection rule, and a Log Analytics destination. Useful tables include WVDConnections, WVDErrors, WVDAgentHealthStatus, and WVDConnectionNetworkData.
Per Microsoft's Insights cost guidance, key counters sample every 30 seconds:
User Input Delay per Session(*)\Max Input DelayProcessor Information(_Total)\% Processor TimeMemory(*)\Available MbytesPhysicalDisk(*)\Avg. Disk sec/Read,/Write, and queue length
Add FSLogix logs (C:\ProgramData\FSLogix\Logs\Profile), Windows event logs, and connection diagnostics to build a timeline.
Step 4: Apply a targeted fix
Compute and density. Microsoft's sizing guidance starts multi-session hosts at 6 users per vCPU for light workloads, 4 for medium, 2 for heavy, and 1 for power. Treat these as starting points and test against your workload. Also review maximum session limits and load balancing.
FSLogix and storage.
- Review profile size and redirection exclusions
- Check storage tier: premium SSD shares have lower latency
- Plan for sign-in spikes (Microsoft examples use 10 IOPS per user steady state, 50 at sign-in)
- Apply security-approved antivirus exclusions, never disable protection
- Check Azure Files for throttling responses
Network. Review region placement, packet loss, VPN or firewall paths, and accelerated networking. Enable RDP Shortpath where supported. It aims at consistent latency, not guaranteed speed gains.
Image and apps. Remove unneeded startup workloads, keep a tested golden image, verify Teams optimization, and isolate abnormal applications.
Scaling and cost. Tune autoscale ramp-up, peak, ramp-down, and off-peak settings, plus capacity buffers. Autoscale capacity is based on session limits, not CPU. Use observed data, not a cost-cutting reflex.
Step 5: Test, validate, and document
- Roll out through a pilot host or canary group, and record the prior configuration.
- Re-run the same user journeys and compare the affected metric.
- Test normal and peak conditions, confirm security controls remain intact, and watch for recurrence.
- Update documentation, alerts, and runbooks.

When to tune, redesign, or call a specialist
Tune when telemetry shows a localized issue and a controlled change fixes it safely.
Redesign when the bottleneck returns after tuning, the image has drifted, storage can't handle concurrent demand, density is consistently wrong, or autoscaling keeps missing demand.
Get specialist help when several layers are involved, monitoring is incomplete, workloads are regulated, or your team can't safely balance performance, cost, identity, and compliance.
TechSogna supports organizations running AVD without dedicated VDI specialists. Its fixed-fee, read-only AVD Health Check starts at $3,500, covers 52 checks across eight areas, and takes about two weeks.
It also offers remediation planning, architecture documentation, Nerdio Manager expertise, and business-hours co-management (Monday to Friday, 9-6 CT).
Preventive Measures and Common Mistakes
Prevention means keeping a measurable baseline, watching trends, and treating performance as an ongoing service.
Common mistakes to avoid
- Treating every complaint as a VM-sizing problem
- Changing several variables at once
- Relying on snapshots instead of trends
- Rebooting hosts without finding the cause
- Using unsafe antivirus exclusions or disabling security controls
- Editing identity or Conditional Access policies without documented testing and approval
Preventive operating practices
- Review host utilization, density, login times, FSLogix storage, network quality, and autoscale results on a schedule.
- Patch base images monthly, as Microsoft recommends, and keep versioned images for rollback.
- Keep agents current, using scheduled agent update windows.
- Maintain runbooks for host drain, rollback, profile recovery, and escalation.
- Set autoscale thresholds from your own pilot data, and deallocate idle hosts off-peak.
Compliance and documentation
In healthcare, federal, financial, or other regulated settings, log performance changes alongside hardening, identity, Intune, Defender, and Conditional Access requirements. Azure's authorizations are a foundation; they don't cover every customer component.
Keep evidence of testing, approvals, monitoring coverage, and rollback procedures so remediation doesn't weaken audit readiness.

Conclusion
AVD slowness usually comes from one constrained or misaligned dependency: compute, density, storage, FSLogix, network, identity, image, or an application. Diagnose first. Collect evidence, make the smallest suitable change, validate under realistic conditions, and document the result.
Ongoing monitoring, with specialist help when needed, keeps an AVD environment responsive, secure, and cost-conscious as workloads change.
Frequently Asked Questions
Why is my Azure Virtual Desktop so slow?
Common causes include overloaded hosts, high user density, FSLogix or storage delays, network latency, image overhead, and insufficient capacity at peak. "Slow" alone doesn't point to one layer, so check telemetry before changing anything.
How can I check Azure Virtual Desktop performance?
Use AVD Insights, Azure Monitor, and Log Analytics together with session host counters, FSLogix logs, and connection diagnostics. Review input delay, RTT, and resource metrics side by side.
What causes slow logins in Azure Virtual Desktop?
Typical causes are large profile containers, slow FSLogix storage, group policy processing, antivirus scanning, startup tasks, and simultaneous logins. Separate connection routing time from host-side logon time.
How do FSLogix profiles affect Azure Virtual Desktop performance?
Profiles mount as remote VHD containers, so large or poorly placed ones delay desktop readiness. Keep profiles lean, put storage near the hosts, and validate security exclusions.
How do I reduce lag and disconnects in Azure Virtual Desktop?
Place users and hosts in suitable regions, check RTT and packet loss, and confirm which RDP transport is active. Enable RDP Shortpath where supported, and verify host capacity, registration, and identity.
When should I resize AVD session hosts or redesign the host pool?
Resize when evidence shows sustained resource pressure. Redesign when bottlenecks recur, density is unsuitable, storage is throttled, or scaling keeps failing. A specialist assessment can help decide.